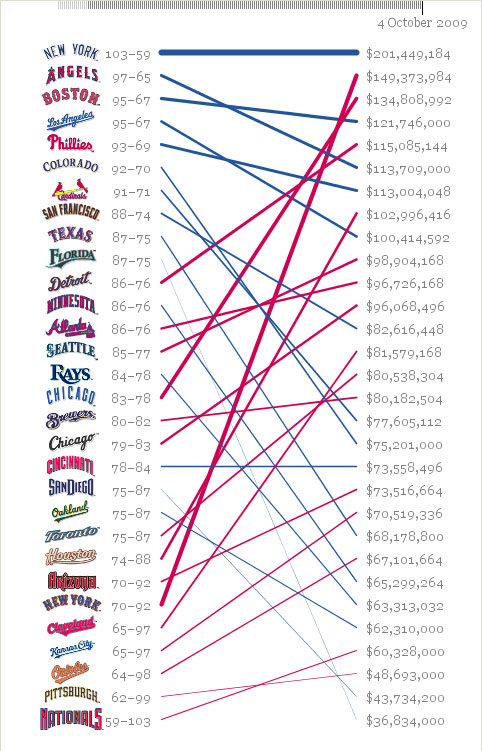
I’ve got baseball on the brain, but at the same time I’m trying not to spend too much time and effort over analyzing every little thing about today’s game. So instead I revisisited one of my favorite baseball sites, Flip Flop Fly Ball to see what latest and greatest graphs and charts were available to peruse. And much to my delight, there was a bobblehead chart! Check it.
The first thing that came to my mind was which two teams gave away a bobblehead when the Giants were visiting. Not an easy thing to figure out without researching every teams’ bobblehead activity, which is what I ultimately ended up doing. (Like I said, this day is crawling way too slowly towards 7 PM!) So using Flip Flop’s own key, I made my own chart:
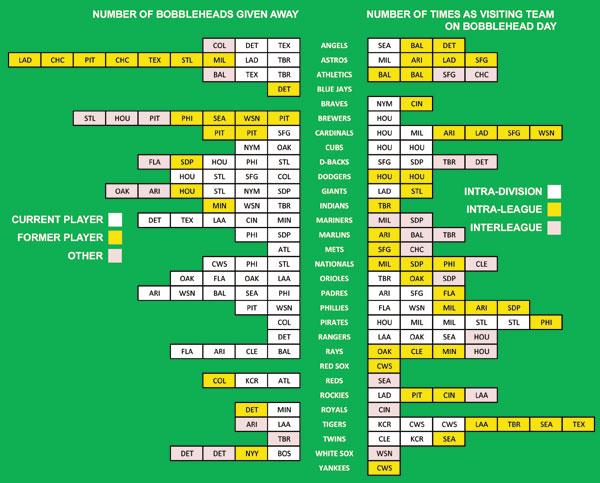
I found a few discrepancies in Flip Flop’s chart, but for the most part they’re the same, square-wise. I added all the applicable teams though, so on the left side you can see what team was visiting during bobblehead day, and on the right you can see what teams gave away a bobblehead while being visiting.
I would have assumed that most teams would decide to give away a bobblehead when they’re scheduled to play a bad team in an attempt to generate ticket sales. The Phillies giving away a Roy Halladay bobblehead on the day they have to play the Pirates makes perfect sense. (And photos of the sucker blew up all over Twitter, so obviously it worked!) But then there’s the Dodgers giving away a bobblehead when the Giants came to play, and what would fill seats better than a Dodgers-Giants game?
Note also that the Braves, Red Sox, Rockies and Yankees are too cool for bobbleheads (or draw enough ticket sales without gimmicks) and the White Sox was the only team to give away a bobble when the Red Sox and Yankees came to town (not enough of a draw for Chicago, I guess).
I wonder if there’s a bobblehead website…